Simples! Isn't it?
I always look forward to a new Avinash blog post. The title of Avinash's blog is Occam's razor - the simplest explanation is usually the best one (entia non sunt multiplicanda praeter necessitatem as I always say!...)
Unfortunately the simplest and best solution, it seems, is seldom chosen. Why is this? What problems does this cause and why did I choose to waffle about this today?
Why so serious?
So why choose to over complicate? What is the motivation to choose complexity where simple answers with fewer moving parts, lower risk and lower cost are available and more appropriate? Brand fixation? Misplaced loyalty? Vendor favouritism? Ignorance? Cognitive miserness - too stingy to think beyond...oh, whatever! Perhaps it's too hard to choose? Perhaps...just perhaps it's the case that a chosen solution is perceived to be better due to the presentation of the solution? Appearing to be simpler or better or requiring less effort (at least in the short term - cognitive miserliness?) is a strong decision making trigger.
Why is this common occurrence a matter for discussion and exploration? As with ANYTHING in life - if the barrier to entry [for a solution] is too high then the level of average quality [of the solution] will be low(er). Take the state of the economy in the UK as an example. Pubic spending has been 'out of control' for years...well, it's been massively wasteful and inefficient due to massive complexity - this much is clear. Is the new government seeking to simplify and add efficiency to resolve the situation? I bloody hope so but this is not a political blather...I want to contextualise on tech..soon.
So, you see what happens when over complex or JPW (Just Plain Wrong) solutions happen? Badness - simple. The fix? Adjust the perception of the actual simple solution compared to that of the complex solution in order to trigger the right choice.
If the simple solution becomes the mean choice this will, in general, lower the bar to entry and the inverse (dis)proportional relationship with quality will yield many more smiles per gallon. Simples, right?
Appear effortless
Well, not quite...The oxymoronic art of presenting a simpler yet better solution still requires a whole bucket of clever!
My TV set has one button - On/Off. Modern aircraft are designed to be simpler to fly through fewer levers and buttons in the cockpit. Automatic gear boxes in cars simplify the job of driving. Heck, I can even use a washing machine (and do!!). These real life examples of 'simpler is better' still contain some mega-clever action under the hood. We don't see (or care) about it though. We see the simple and subconsciously blank out the clever. Our perception of these solutions for life problems is that they are simple. They are presented in a way such that the 'simple' is IN-YOUR-FACE. You can't miss the simple. The solution appears effortless whilst in actuality they are 110% smart. Tricky but so worth the effort.
Get to the point already
Yes - where is this going? So - the crux...I can't tell you the full details yet. The solution will be an Open Source product for the measurement and control of website performance. It is clear that the majority of Web Analytics solutions whilst appearing smart and good are actually harming rather than helping. There is a better way and it will be delivered democratically, for free and doable with apparent effortlessness. Think 'one liner' solution that does all the things you need with little or no thought.
Interested?
Here is a promise - simples will be better and unavoidable.
Saturday, 5 June 2010

Sunday, 4 April 2010
Understanding the Mclaren F1 rear wing 'stall' device
The 2010 Mclaren F1 car has a clever device to make the car go faster on the straights be reducing drag from the rear wing. Martin Brundle (and many other journalists) has, I think described the so called 'Rear Wing Stall Device' poorly.
Here is an explanation using basic aerodynamic theory that shows that the wing does not actually 'stall' but appears to 'get smaller'.
Here is a normal aeroplane wing:

Air flows over the curved top surface of the wing as it moves forwards through the air. Because the air is being made to change direction the air molecules bash into each other as they bend around the curved wing. All this bashing around makes the molecules move further apart - they need more space to bash and move and bend. Moving further apart reduces the pressure of the air on the top of the wing. This reduction in pressure on top actually sucks the wing up.
The stall.
For this suction effect to work properly, the air needs to move around the wing surfaces and stay nice and close to the surface. If the direction of the airflow changes so that the flow is perpendicular rather than head on then obviously the wing will not work. It presents it's bottom surface and behaves like a fence panel being blown by the wind in a storm. Lots of force in the wrong direction = drag! This is a stall. A stall does reduce the downforce of a wing but it will INCREASE a wing's drag - NOT REDUCE it!
Here is a normal formula one wing:

See how the wing is angled to optimise the downforce but not cause a stall as described above? Notice also that it appears to be upside down? A formula one wing wants to push/suck down where an aircraft wing wants to push/suck up.
So, if the Mclaren rear wing device is not stalling the wing what is it doing? A non-stalled wing will create a force in the correct direction (down for F1) but in doing so it will also cause another force to act one the wing - drag. The wing creates this force as described earlier by creating a pressure differential - the high or ambient pressure on the flat side of the wing and the low pressure on the curved side of the wing. The Mclaren device essentially opens a channel through the wing to remove or reduce the pressure differential between the surfaces.

This reduction in the pressure differential will reduce the downforce but also reduce drag all without stalling the wing.
The super clever bit about this device is how it is controlled. No clever computers involved - just a knee! The driver opens or closes the channel by blocking a vent with his knee thus controlling the pressure differential over the rear wing.
Smart.
Here is an explanation using basic aerodynamic theory that shows that the wing does not actually 'stall' but appears to 'get smaller'.
Here is a normal aeroplane wing:
Air flows over the curved top surface of the wing as it moves forwards through the air. Because the air is being made to change direction the air molecules bash into each other as they bend around the curved wing. All this bashing around makes the molecules move further apart - they need more space to bash and move and bend. Moving further apart reduces the pressure of the air on the top of the wing. This reduction in pressure on top actually sucks the wing up.
The stall.
For this suction effect to work properly, the air needs to move around the wing surfaces and stay nice and close to the surface. If the direction of the airflow changes so that the flow is perpendicular rather than head on then obviously the wing will not work. It presents it's bottom surface and behaves like a fence panel being blown by the wind in a storm. Lots of force in the wrong direction = drag! This is a stall. A stall does reduce the downforce of a wing but it will INCREASE a wing's drag - NOT REDUCE it!
Here is a normal formula one wing:
See how the wing is angled to optimise the downforce but not cause a stall as described above? Notice also that it appears to be upside down? A formula one wing wants to push/suck down where an aircraft wing wants to push/suck up.
So, if the Mclaren rear wing device is not stalling the wing what is it doing? A non-stalled wing will create a force in the correct direction (down for F1) but in doing so it will also cause another force to act one the wing - drag. The wing creates this force as described earlier by creating a pressure differential - the high or ambient pressure on the flat side of the wing and the low pressure on the curved side of the wing. The Mclaren device essentially opens a channel through the wing to remove or reduce the pressure differential between the surfaces.
This reduction in the pressure differential will reduce the downforce but also reduce drag all without stalling the wing.
The super clever bit about this device is how it is controlled. No clever computers involved - just a knee! The driver opens or closes the channel by blocking a vent with his knee thus controlling the pressure differential over the rear wing.
Smart.
Saturday, 13 March 2010
Selling PPC to your clients - how hard can it be?
The Challenge of Selling Paid Search.
What? Selling PPC? Well, I have a wide range of tools at my disposal to help optimise the return my clients get from their sites: Paid Search is one of them. So, I need to sell the idea, the concept and the benefits to clients to get them to make an investment. Not everyone gets it though. Not all clients see why they should run the risk of (potentially as they see it) hemorrhaging cash to Google/MS/Yahoo to get traffic that they could get through a nice safe strategy like their trusted paper catalogue...
Sell on benefits, not features
So, this missive is not about PPC itself but more about selling PPC to those who can really get benefit from it but are frozen by doubt. Let's discuss what buttons need to be pushed to persuade business owners that paid advertising can provide a good return on investment.
Theirs is an understandable sentiment: As a business owner unfamiliar with PPC, you don't know how much it'll cost to put an advert somewhere on a search engine results page potentially near a competitor without knowing exactly what caused the advert to show when and where it did.
Start small on safe ground
How do you even know if your products will sell well through PPC? Just a little legwork will provide some pretty compelling arguments. Simple tools like http://www.google.com/sktool or https://adwords.google.co.uk/select/KeywordToolExternal are easy to use and free. The information that can be found through these tools can be a gold mine. Just gotta find the seam...Hey! Why not start with a small time 'punt' using campaigns and keywords centered around the client's brand?
The so called madness of bidding on own brand keywords is actually a really good candidate to demonstrate great competitive advantages that can be gained through using paid advertising. Some examples for clients:
If you don't someone else will!
Beat your competitors on your own turf. It's your backyard - own it.
Turbo charge the Click Through Rate on the account
CTR has a significant effect on your campaign quality score. Get the positive cycle going with Click Through Rate. Strong brand keywords can kick start your campaigns
SEO benefits - KNOW the keywords that work for you
Transfer keyword learning into site copy which leads to...
The halo effect
Starting out with paid advertising will quite often cause a boost in organic traffic performance too.
Target Cost Per Acquisition
Seek to maximise the lifetime value of PPC customers and transfer this strategy to other channels for optimal ROI.
Okay, the last point there is suitable material for a whole blog post in it's own right but nonetheless, this handfull of straightforward, easy wins provide enough of a comfort for clients to dive in the shallow end of the paid advertising pool.
More often than not, they find the water is lovely!
Saturday, 20 February 2010
Web Analytics - Don't get caught out by averages and ratios.
The Scenario
We sent an email to a few thousand customers. It was utm tagged so the performance of the email could be measured.
If you don't measure it, you can't improve it!
The Headline Results
The graph of visits over time, below, from Google Analytics shows a familiar shape:

Now, visits are great - we like visits. Our customers are wonderful and it's great to know they like our website...enough to buy stuff? Show me the money! So, let's bring in some more metrics on the graph. Say, visits and revenue:

Okay, visits and blue and $$$ in orange. Looks about right. Yup. So, visits and transactions. How many orders does our email generate?

Great - clearly our back to back email testing is looking great! We wanted to drive more sales but what happened to our average cart value? Lets drag in another metric to compare with our visits:

Huh? That looks odd, don't you think? It seems as if our average order value seems to increase as our visits diminish...
First mistake
Look at the average order value metric over the life span of a campaign. If you haven't changed the campaign during the chosen time period, AOV will be independent of the visits metric. Don't look at AOV by day - it's an average so use a wider date range to pull a richer body of data together.
So, we understand a little more about how to use the average order value metric but the title of this missive is a warning about ratios as well as averages...let's look at visits compared to conversion rate:

Now this does look odd - isn't it somewhat counter intuitive that the holy grail of all metrics should go up...after visits trail off and then dip and rise again. Gah!
Think about what's happening here: We saw that our AOV was roughlyconsistent...rising slightly even. Well, we can see our visits peak early on and then exhibit the classic long tail pattern. Given that we have seen a close correlation between visits and transactions and our conversion rate is the ratio of transactions to visits, clearly we will see our conversion rate change with the inverse of transactions.
So, in the same way that we would examine the average order value over a multiple day period, we would apply the same analysis methodology to conversion rate.
So, as we were testing one email design against another, we would look at the average order value and conversion rate over a period of say, a week after the email was sent and look for a difference in the metrics. Then of course, seeing mathematical confirmation of statistical significance (say through a simple Student's t-test) is the next step to confirm (or refute) the hypothesis that gave rise to the test in the first place.
We sent an email to a few thousand customers. It was utm tagged so the performance of the email could be measured.
If you don't measure it, you can't improve it!
The Headline Results
The graph of visits over time, below, from Google Analytics shows a familiar shape:

Now, visits are great - we like visits. Our customers are wonderful and it's great to know they like our website...enough to buy stuff? Show me the money! So, let's bring in some more metrics on the graph. Say, visits and revenue:

Okay, visits and blue and $$$ in orange. Looks about right. Yup. So, visits and transactions. How many orders does our email generate?

Great - clearly our back to back email testing is looking great! We wanted to drive more sales but what happened to our average cart value? Lets drag in another metric to compare with our visits:

Huh? That looks odd, don't you think? It seems as if our average order value seems to increase as our visits diminish...
First mistake
Look at the average order value metric over the life span of a campaign. If you haven't changed the campaign during the chosen time period, AOV will be independent of the visits metric. Don't look at AOV by day - it's an average so use a wider date range to pull a richer body of data together.
So, we understand a little more about how to use the average order value metric but the title of this missive is a warning about ratios as well as averages...let's look at visits compared to conversion rate:
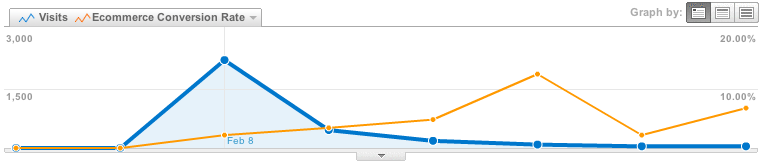
Now this does look odd - isn't it somewhat counter intuitive that the holy grail of all metrics should go up...after visits trail off and then dip and rise again. Gah!
Think about what's happening here: We saw that our AOV was roughlyconsistent...rising slightly even. Well, we can see our visits peak early on and then exhibit the classic long tail pattern. Given that we have seen a close correlation between visits and transactions and our conversion rate is the ratio of transactions to visits, clearly we will see our conversion rate change with the inverse of transactions.
So, in the same way that we would examine the average order value over a multiple day period, we would apply the same analysis methodology to conversion rate.
So, as we were testing one email design against another, we would look at the average order value and conversion rate over a period of say, a week after the email was sent and look for a difference in the metrics. Then of course, seeing mathematical confirmation of statistical significance (say through a simple Student's t-test) is the next step to confirm (or refute) the hypothesis that gave rise to the test in the first place.
Monday, 15 February 2010
RealTime Analytics Part 2
The second part of the Real Time Analytics blog series is found over on 'my other blog':
Analytics in Real Time - What IS art?
Analytics in Real Time - What IS art?
Sunday, 17 January 2010
Real Time Web Analytics
S'up ya'll?
So 'the kids' greet each other these days. A question. What's happening? An informal contemporary slant on the classic plum filled mouthful: 'How do you do?'.
The desire to acquire information is part of the human condition. The fresher the news the better. This modern media-fueled era provides a massive real-time information stream. Inevitably the majority of the data in the myriad real-time streams is fecund and worthless - still we feel the need to seek out newness. Vanity? Probably...but every so often, as if panning for gold, in the flowing, babbling stream, we find some juicy, valuable nugget of goodness. It's hard to put down after that.
It should already be obvious that the title wraps some context around this missive. I have thought long and hard about the subject of real time web analytics data capture and usage since reading a (typically) cracking post by Avinash Kaushik. In general, I agree with what Avinash (and many others) say on the real time subject but... Always a 'but' ;-)
The post in question was published back in late 2006. Since then, the zeitgeist has changed massively and continues to do so. For example, smarter and more powerful mobile devices coupled with Twitter and Facebook and real-time search results influence how and when our messages to the world are consumed. Sooner! The degree of urgency with which individuals and organisations can now communicate on a global scale is remarkable and, I think, changes the web analytics game somewhat.
Solution in Alpha
I've been trying to find a good name for it. Play around with the word order and you get Web Analytics Real-Time which delivers a less than frisky acronym as a solution title. Imagine the pitch - 'Would you like to see our W.A.R.T.?" Nah. Just doesn't fly.
Forget the product name for now, I am rolling out a private Beta programme for my W.A.R.T. in the next week or so. I'll get a clear idea of scalability, how hard it is to use (knife and fork complexity is the ideal) and with a big nod and doffed cap in the direction of Avinash for the original inspiration, what value can be delivered.
Further posts will reveal more details about what it can do...
And finally...
On a non-technical subject, I would like to re-focus my flying on SSDR Flexwings. I wonder where I can learn flexwings near London?
Monday, 4 January 2010
Social Media Analytics - expanding the envelope
Avinash...Avinash...AVINASH!
I'm not turning into Steve Balmer (thank goodness) just enthusiastic and inspired by a recent blog post by Avinash (general Web analytics Guru and all round good chap).
In his blog post Avinash points out a fine set of actionable insights that can be gleaned from metrics generated by social media. For example, beyond the 'x followers' type metric on Twitter, Avinash describes how we can look at # of retweets per 1000 followers. Indeed - the impact of one's Twitter stream goes beyond the simple action of following a Twitterer because of an occasionally amusing or interesting 140 char missive. What happens when it turns out the Twitter stream in question is lame? Unfollow...sad though it may be.
Fastbloke...Fastbloke...FASTBLOKE!!!
Ahem, sorry about the outburst there...moving swiftly on:
So, looking at social media (blogging, Facebook, Twitter etc.) from a Web Analytics 2.0 perspective we can treat a simple retweet or new follower/feed subscriber/friend as 'outcome proxies'. What might be called 'vanity metrics' actually have more use than you might think.
One outcome we are interested in from our social media marketing efforts is the delta in long term subscribers/followers/friends. Assume that we can see with our classic Web Analytics analysis techniques that social media 'customers' add value to our business...given the meager spend on Tweets and blogs, the cost of acquisition of a loyal friend on Facebook is really quite slight compared to say a PPC or email click. There is insight to be had here!
In other words, a significant delta in our outcome proxies needs to be understood so it can be fully capitalised. What if I suddenly get a massive leap (OR DROP!) in followers/friends/subscribers? What were the influences? Was it the last post or update? Can external/offline marketing influences be attributed?
Social media outcomes need to be tracked and analysed
In the same way as one analyses the performance of entrance and exit pages on a website we can consider a tweet that yields new followers as the 'entrance tweet' and a corresponding 'exit tweet' for the converse situation.
Did a certain blog post cause subscribers to unsubscribe? We consider 'unsubscribe rate' as an email marketing effectiveness metric - does the same apply to other forms of social media? Can we consider segmented friends lists? Consider (read test) tweeting and blogging at a certain time of day or day of week or frequency?
Always consider content first though!
Viral quotient is an awesome metric but the basic building blocks of analytics 1.0 can still add value.
I'll be starting with the new annotation functionality in Google Analytics real soon but I will also be experimenting with techniques to integrate friends/followers/subscriber metrics with current web analytics data sources.
Maybe Google/Yahoo/Omniture or some other web analytics vendor will beat me to the solution. I look forward to it.
Subscribe to:
Posts (Atom)