We sent an email to a few thousand customers. It was utm tagged so the performance of the email could be measured.
If you don't measure it, you can't improve it!
The Headline Results
The graph of visits over time, below, from Google Analytics shows a familiar shape:

Now, visits are great - we like visits. Our customers are wonderful and it's great to know they like our website...enough to buy stuff? Show me the money! So, let's bring in some more metrics on the graph. Say, visits and revenue:

Okay, visits and blue and $$$ in orange. Looks about right. Yup. So, visits and transactions. How many orders does our email generate?
Great - clearly our back to back email testing is looking great! We wanted to drive more sales but what happened to our average cart value? Lets drag in another metric to compare with our visits:

Huh? That looks odd, don't you think? It seems as if our average order value seems to increase as our visits diminish...
First mistake
Look at the average order value metric over the life span of a campaign. If you haven't changed the campaign during the chosen time period, AOV will be independent of the visits metric. Don't look at AOV by day - it's an average so use a wider date range to pull a richer body of data together.
So, we understand a little more about how to use the average order value metric but the title of this missive is a warning about ratios as well as averages...let's look at visits compared to conversion rate:
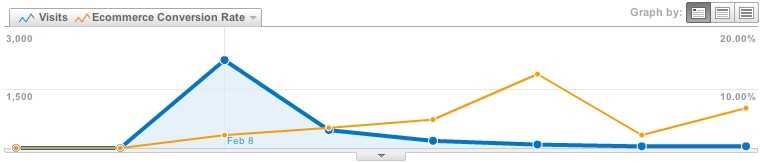
Now this does look odd - isn't it somewhat counter intuitive that the holy grail of all metrics should go up...after visits trail off and then dip and rise again. Gah!
Think about what's happening here: We saw that our AOV was roughlyconsistent...rising slightly even. Well, we can see our visits peak early on and then exhibit the classic long tail pattern. Given that we have seen a close correlation between visits and transactions and our conversion rate is the ratio of transactions to visits, clearly we will see our conversion rate change with the inverse of transactions.
So, in the same way that we would examine the average order value over a multiple day period, we would apply the same analysis methodology to conversion rate.
So, as we were testing one email design against another, we would look at the average order value and conversion rate over a period of say, a week after the email was sent and look for a difference in the metrics. Then of course, seeing mathematical confirmation of statistical significance (say through a simple Student's t-test) is the next step to confirm (or refute) the hypothesis that gave rise to the test in the first place.